Authors: Sana Hamiane, Youssef Ghanou, Hamid Khalifi, Aziz Boujeddaine
Introduction & The Forecasting Challenge
Accurate forecasting of Gross Domestic Product (GDP) is a foundational pillar of econometric modeling and macroeconomic policymaking. It provides policymakers, central banks, and market participants with crucial insights into the direction of economic growth. However, economic time series are notoriously complex, dynamic, and non-linear. They are heavily subject to structural shocks (e.g., the 2008 global financial crisis, the COVID-19 pandemic) and regime changes.
Historically, macroeconomic forecasting relied on linear statistical models:
- ARIMA (Autoregressive Integrated Moving Average)
- VAR (Vector Autoregression)
While simple and interpretable, these classical approaches assume linearity and stationarity, failing to capture the complex, interactive, and non-linear relationships of modern economic indicators. While machine learning algorithms (like Random Forest, XGBoost, and Support Vector Regression) offer a flexible alternative, they struggle to model long-term temporal dependencies in sequential data.
This study proposes a hybrid deep learning model combining Convolutional Neural Networks (CNN) and Bidirectional Long Short-Term Memory (BiLSTM) networks, optimized using a Genetic Algorithm (GA), to forecast Morocco's quarterly real GDP.
Methodology Workflow
Figure: GA-CNN-BiLSTM Methodology Flowchart
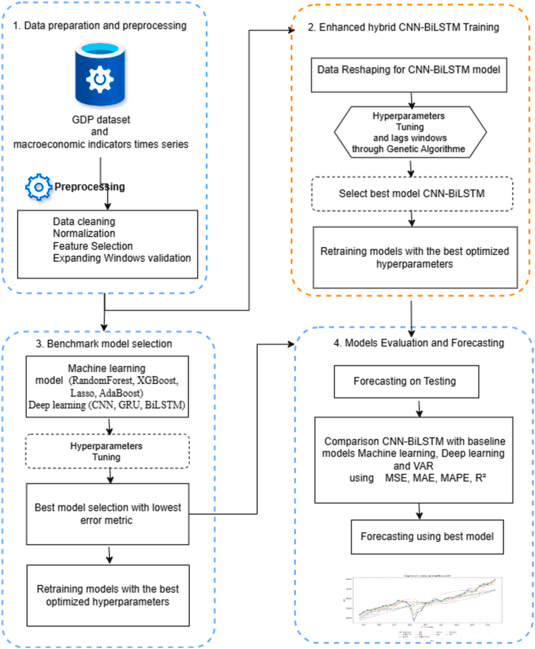
The GA-CNN-BiLSTM methodology is structured into four main stages:
- Feature Selection: Identifies key sectoral predictors using Spearman correlation and Mutual Information, followed by XGBoost-based ranking and SHAP explainability.
- Hybrid Network: The CNN layer extracts local temporal patterns and cyclical fluctuations, while the BiLSTM layer captures long-term structural dependencies in both forward and backward directions.
- Genetic Algorithm: Optimizes nine hyperparameters, including the lag window, filters, kernels, hidden units, dropout rates, learning rate, and batch size.
- Monte Carlo Dropout: Generates 95% prediction intervals to quantify forecast uncertainty.
Two-Stage Feature Selection & SHAP Interpretation
To prevent redundancy and dimensionality issues, we apply a robust two-stage feature selection process on 15 candidate macroeconomic indicators from Morocco's Haut-Commissariat au Plan (HCP) (Q1 1980 to Q3 2025):
- Stage 1 (Pre-filtering): Spearman rank correlation filters linear trends, while Mutual Information (MI) captures non-linear dependencies.
- Stage 2 (XGBoost & SHAP): XGBoost ranks features within an expanding-window strategy, and SHAP (SHapley Additive exPlanations) provides economic interpretation.
SHAP Global Feature Importance
The SHAP global importance results highlights the ranking and contribution of the 7 retained predictors:
| Feature | Mean Abs SHAP | Contribution % | Economic Interpretation & Rationale |
|---|---|---|---|
| Public Admin & Social Security | 40,951.73 | 53.29% | Dominant role of public expenditures, civil service salaries, and social safety nets. |
| Education, Health & Social Work | 13,494.79 | 17.56% | Direct reflection of value added by non-market service sectors and human capital. |
| Net Taxes on Subsidies | 7,263.54 | 9.45% | Production approach factor: GDP at market prices includes taxes minus subsidies. |
| Real Estate & Business Services | 6,530.58 | 8.50% | Key dynamic sectors driving market services and capital formation in Morocco. |
| Electricity, Gas & Water Supply | 3,932.18 | 5.12% | Critical infrastructure activity supporting manufacturing and households. |
| Manufacturing Industries | 2,698.18 | 3.51% | Core industrial value-added, subject to local and global demand variations. |
| Agriculture, Forestry & Fishing | 1,975.88 | 2.57% | Traditionally volatile sector due to weather shocks, yet foundational for growth. |
Hybrid GA-CNN-BiLSTM Architecture
The core of our forecasting engine is a hybrid deep learning model:
- CNN Layer: Captures local spatial-temporal features, short-term business-cycle fluctuations, and local sectoral activity.
- BiLSTM Layer: Processes sequence features in both forward and backward directions to capture long-term macro dependencies and delayed effects.
Hyperparameter Optimization using Genetic Algorithm
Deep learning architectures are highly sensitive to hyperparameter choices. To solve this, a Genetic Algorithm (GA) optimizes nine hyperparameters simultaneously. Before running, a preliminary grid search was conducted to identify the best control parameters for the GA itself:
- Crossover probability ($cxpb = 0.7$)
- Mutation probability ($mutpb = 0.2$)
- Tournament size ($tournsize = 3$)
- Population = 20, Generations = 30
The optimal configurations identified by the GA are:
| Hyperparameter | Search Range | Optimal Value (GA) |
|---|---|---|
| Time Lag Window | [4, 6, 8, 10, 12, 14, 16] | 12 quarters |
| CNN Filters | [10 - 150] | 83 |
| CNN Kernel Size | [3 - 7] | 5 |
| Max Pooling Size | [1 - 3] | 1 |
| CNN Dropout Rate | [0.0 - 0.6] | 0.15 |
| BiLSTM Hidden Units | [10 - 150] | 137 |
| BiLSTM Dropout Rate | [0.0 - 0.6] | 0.15 |
| Dense Layer Units | [10 - 150] | 34 |
| Learning Rate | [1e-5 - 1e-2] | 0.0068 (Adamax) |
Experimental Results & Performance Comparisons
The proposed model was tested using an expanding-window strategy (Q4 2018 to Q3 2025). The GA-CNN-BiLSTM model significantly outperformed machine learning, traditional statistical (VAR), and individual deep learning models:
Overall Model Performance Metrics
| Model | $R^2$ | MSE | MAE | MAPE (%) |
|---|---|---|---|---|
| GA-CNN-BiLSTM | 0.9851 | 0.0149 | 0.0088 | 0.89% |
| BiLSTM | 0.9745 | 0.0255 | 0.0084 | 0.84% |
| CNN | 0.9730 | 0.0270 | 0.0119 | 1.25% |
| AdaBoost | 0.9181 | 0.0819 | 0.0216 | 2.18% |
| Lasso | 0.8062 | 0.1938 | 0.0315 | 3.09% |
| XGBoost | 0.7208 | 0.2792 | 0.0401 | 3.99% |
| VAR | 0.7055 | 0.2945 | 0.0291 | 2.92% |
| GRU | 0.7002 | 0.2998 | 0.0241 | 2.50% |
| Random Forest | 0.5780 | 0.4220 | 0.0524 | 5.20% |
Robustness & Shock Resilience
To evaluate resilience to macroeconomic shocks, we compare GA-CNN-BiLSTM with a traditional Vector Autoregressive (VAR) model during normal and shock periods (such as the COVID-19 pandemic):
| Period | Model | MAPE (%) | MAE | MSE |
|---|---|---|---|---|
| Shock Period | GA-CNN-BiLSTM | 1.63% | 0.0314 | 0.0040 |
| VAR | 4.93% | 0.1522 | 0.0422 | |
| Normal Period | GA-CNN-BiLSTM | 0.68% | 0.0124 | 0.0002 |
| VAR | 2.61% | 0.0928 | 0.0126 |
In addition, we quantified forecast uncertainty using Monte Carlo Dropout (50 stochastic forward passes at inference), obtaining a highly reliable 95% Prediction Interval:
- Prediction Interval Coverage Probability (PICP): 98.59%
- Mean Prediction Interval Width (MPIW): 34,794.27
- Prediction Interval Normalized Average Width (PINAW): 0.2488
Conclusion & Outlook
This research demonstrates that combining CNN features (capturing local sectoral dynamics) with BiLSTM sequences (capturing long-term temporal trends), optimized via Genetic Algorithms, provides a state-of-the-art framework for GDP forecasting in Morocco.
The SHAP explainability layer connects complex non-linear outputs back to HCP's production approach, creating trust for policy decisions. Future extensions could incorporate high-frequency indicators (electricity consumption, tourism arrivals) to establish a real-time nowcasting framework.